
LA Data
The Lewis Center produces, hosts, and shares data to help planners, policymakers, and researchers assess how people live, move, and work in the Los Angeles region. Data resources include:
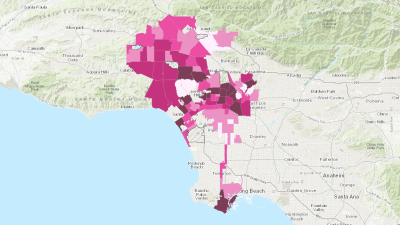
LA Commercial Sidewalk and Al Fresco Trends
These interactive maps explore the spatial trends related to commercial sidewalks and Los Angeles’s outdoor dining program — LA Al Fresco. They are companion pieces to the Lewis Center publication, “Improving Access to Outdoor Dining Opportunities: Analyzing the Constraints of LA Al Fresco.”
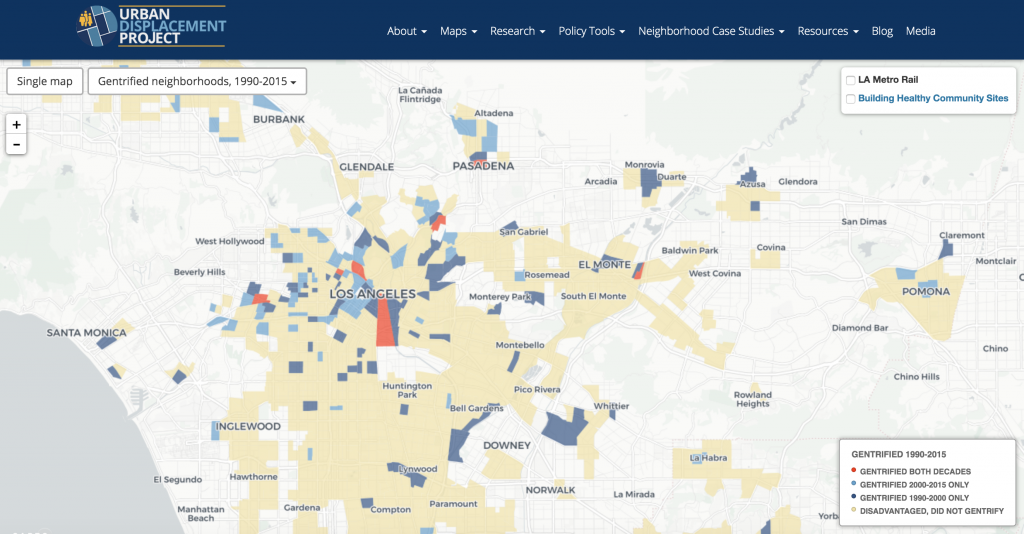
The Urban Displacement Project
The Urban Displacement Project produces rigorous research on neighborhood change to help stakeholders better understand where neighborhood transformations are occurring and to identify areas that are vulnerable to gentrification and displacement in both transit and non-transit neighborhoods. In addition to areas of gentrification, the interactive map showcases data for factors such as job density, racial-ethnic composition, and individual poverty rates within Los Angeles, Orange, and San Diego Counties. The urban displacement project is a joint effort between UC Berkeley, UCLA, and Portland State.
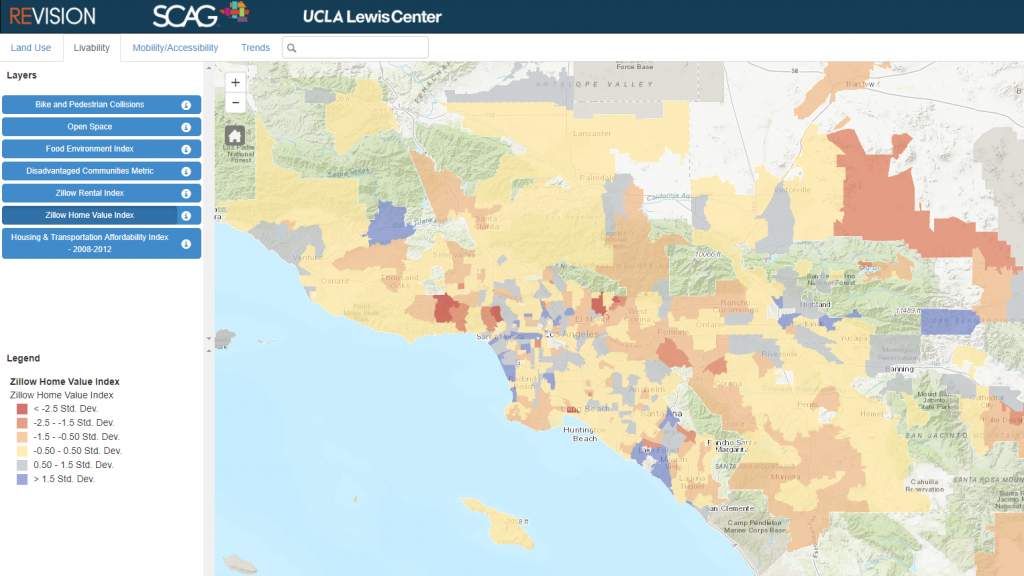
REVISION
The REVISION Data Portal is a regional mapping and analysis application that integrates a range of public and private data for sustainable community planning and trend visualization. In partnership with the Southern California Association of Governments and California Strategic Growth Council, the Lewis Center maintains REVISION data on land use, livability, mobility, and accessibility. The interactive map explores growth forecasts, bikeway networks, employment patterns, and much more.
Los Angeles County Quality of Life Index
The Lewis Center is proud to host data from the Los Angeles Initiative, an annual public opinion poll representing a cross-section of Los Angeles County residents, who are asked questions about their satisfaction with up to 40 aspects of quality of life across nine categories. Each category receives an individual index score and the category index scores are combined and weighted by salience to create an overall index score.
Southern California Data Resources
In addition to tools we host, the Lewis Center provides a list of data available across our research areas for students and stakeholders to conduct their own analysis and answer pressing questions about the Los Angeles region.